Model Evaluation and Validation
Outline:
- Regression and Classification
- Testing
- Confusion Matrix
- Accuracy
- Regression Metrics
- Types of Errors
- Model Complexity Graph
- K-Fold Cross Validation
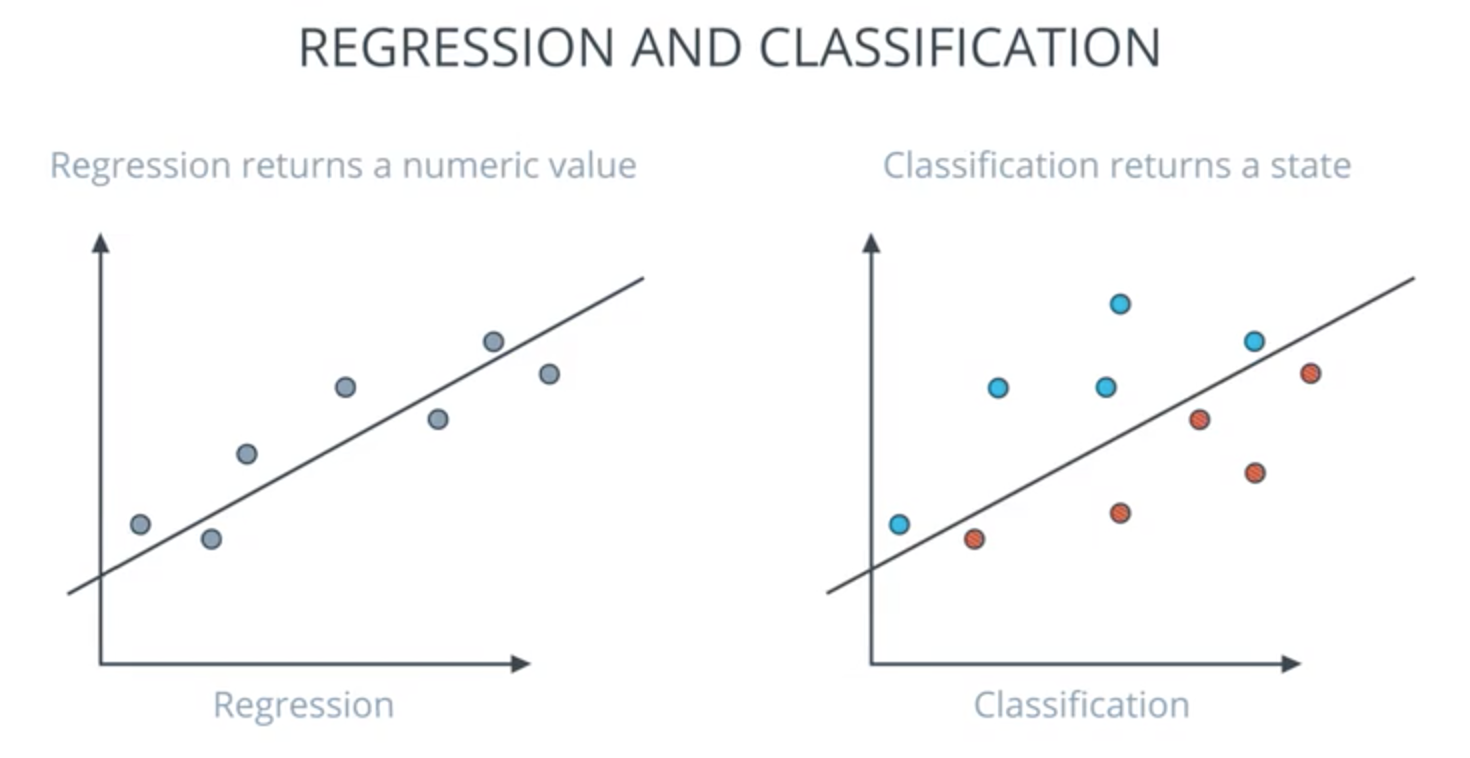
Regression and Classification
- Regression returns a numeric value:
- new value in X axis, then approximate to find value Y
- Classification returns a state:
- positive or negative, yes or no, dog and cats
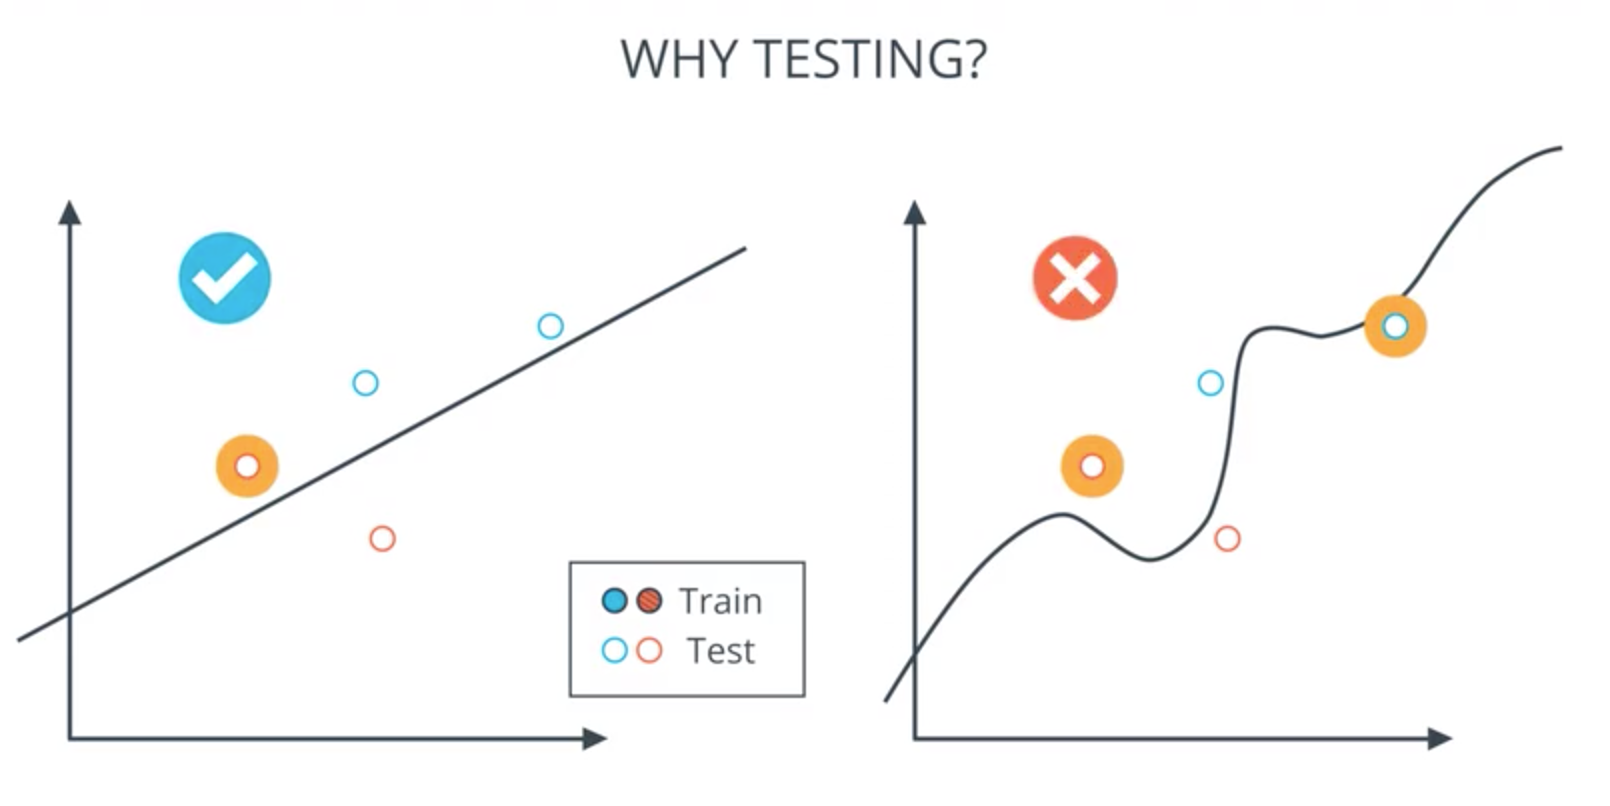
Testing
- How well is my model doing?
- How to find a model that generalizes well?
- Never use your testing data for training.
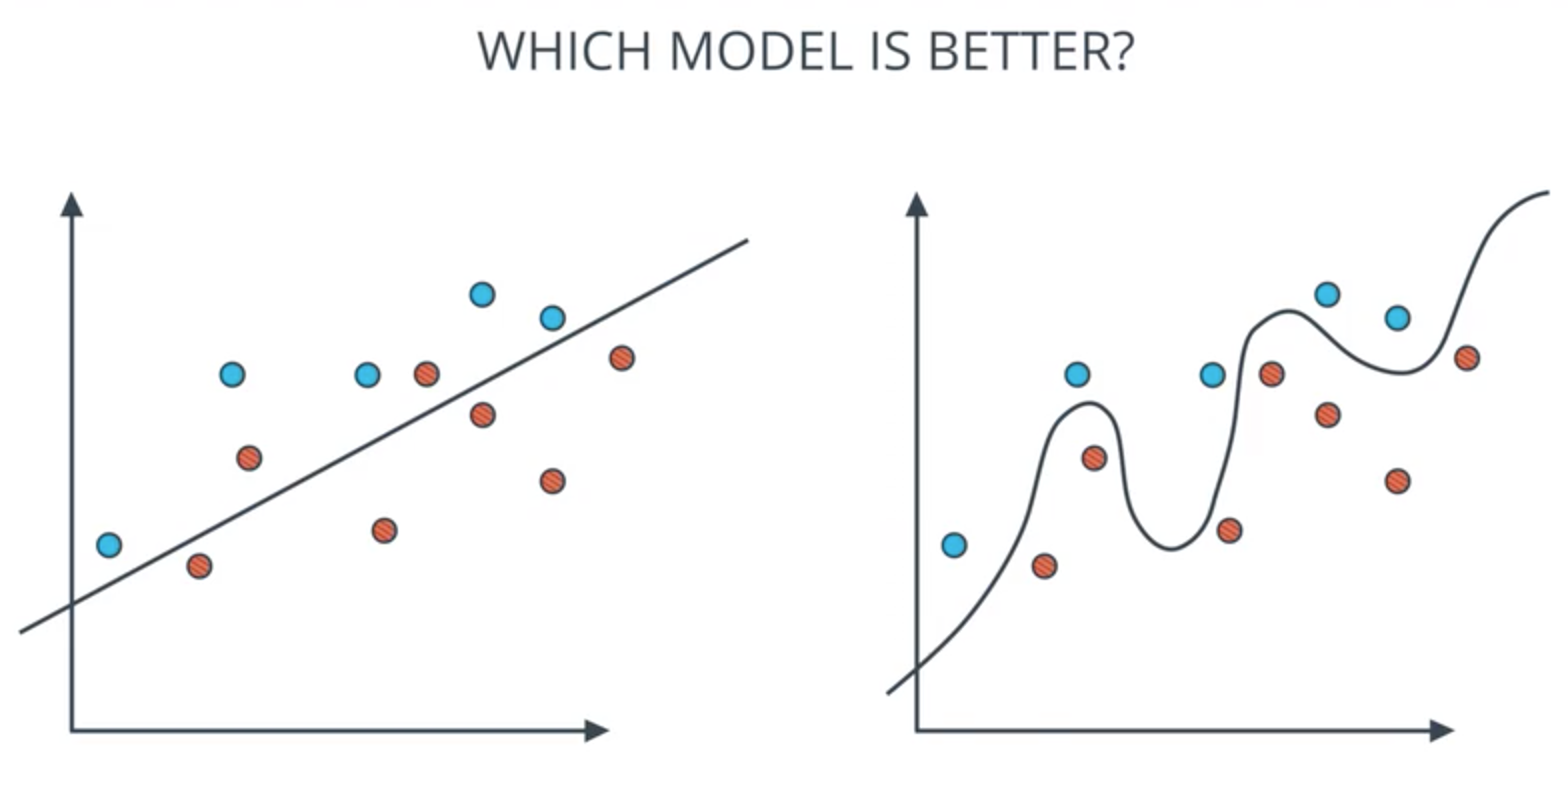
Which model is better?:
Split data to train and test:
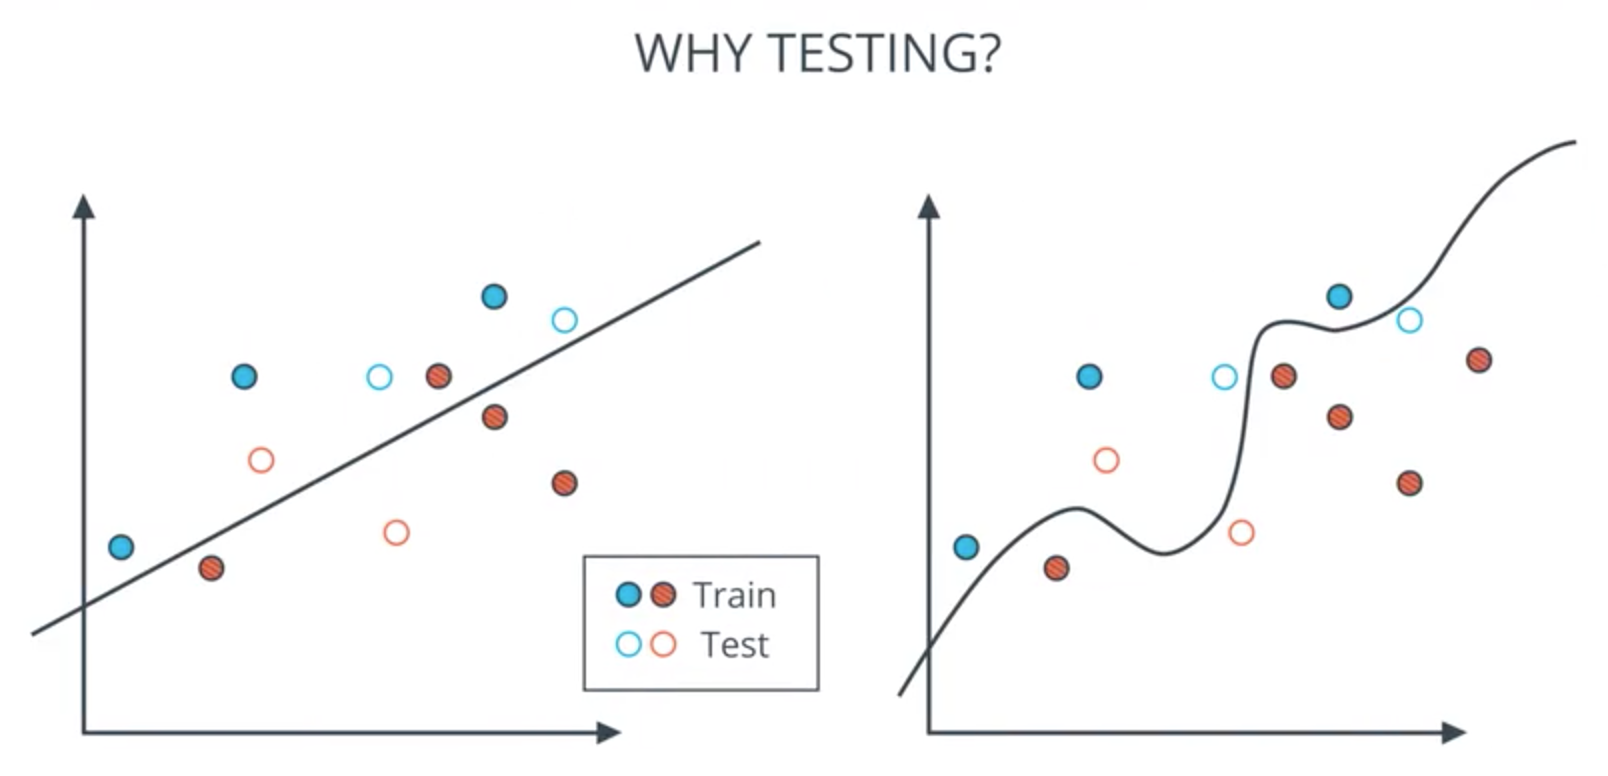
Test results:
Code:
from sklearn.model_selection import train_test_split

X_train, X_test, y_train, y_test = train_test_split(X, y, test_size = 0.25)
Confusion Matrix
- How well is my model doing?
Example:
- Blues are True, Red are Negative
- Line above are Positive, below are False
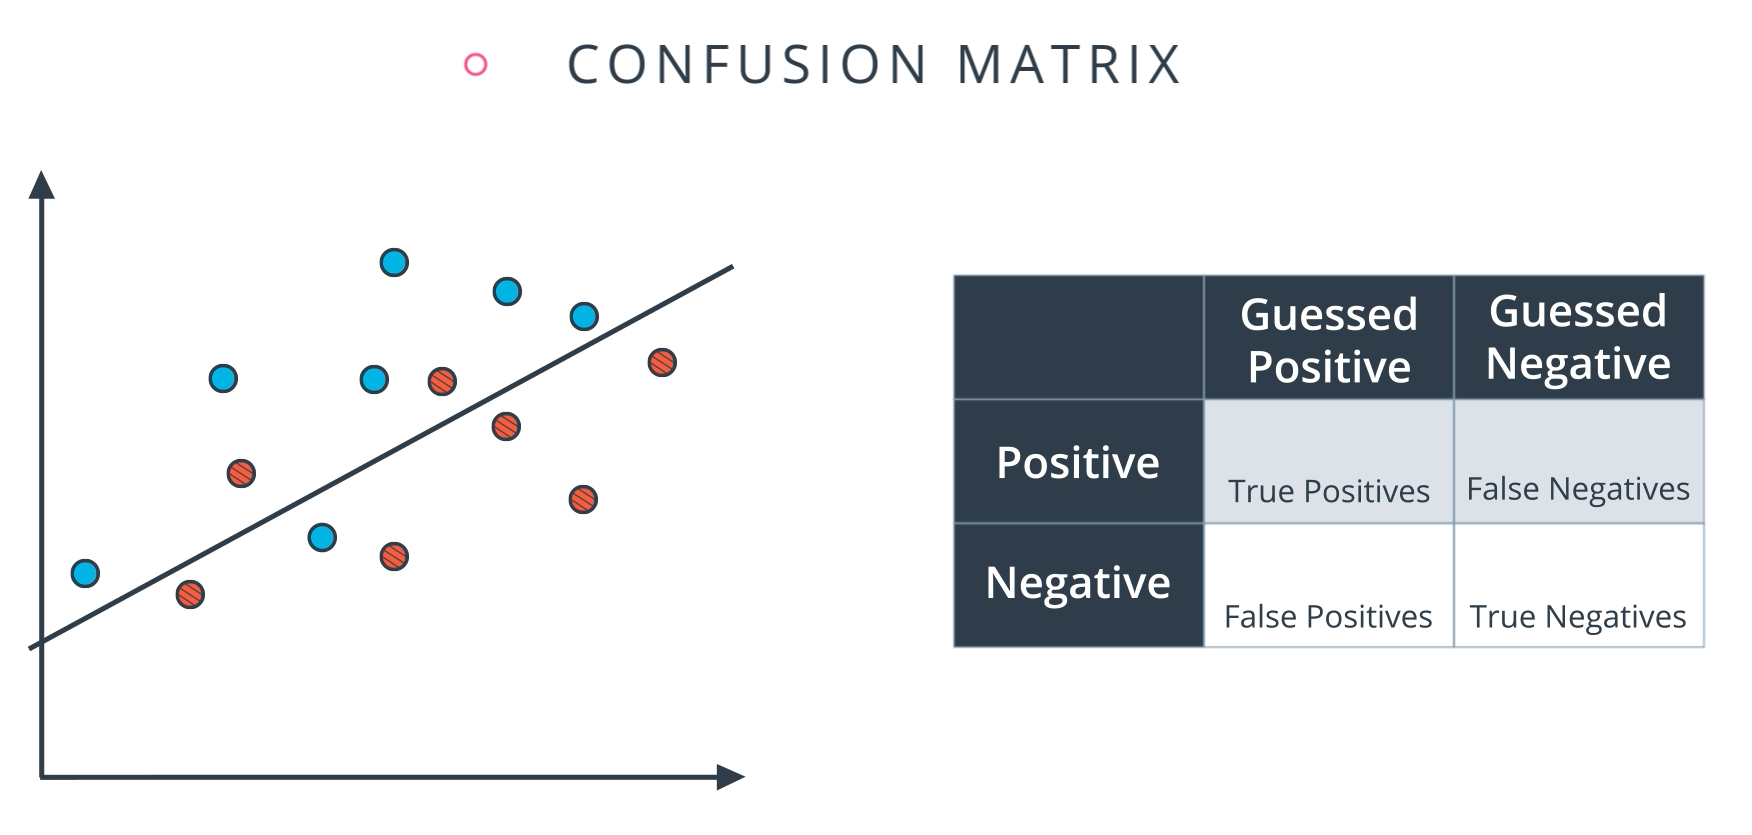
Then:
- True Positive: 6, True Negative: 5, False Positive: 2, False Negative: 1
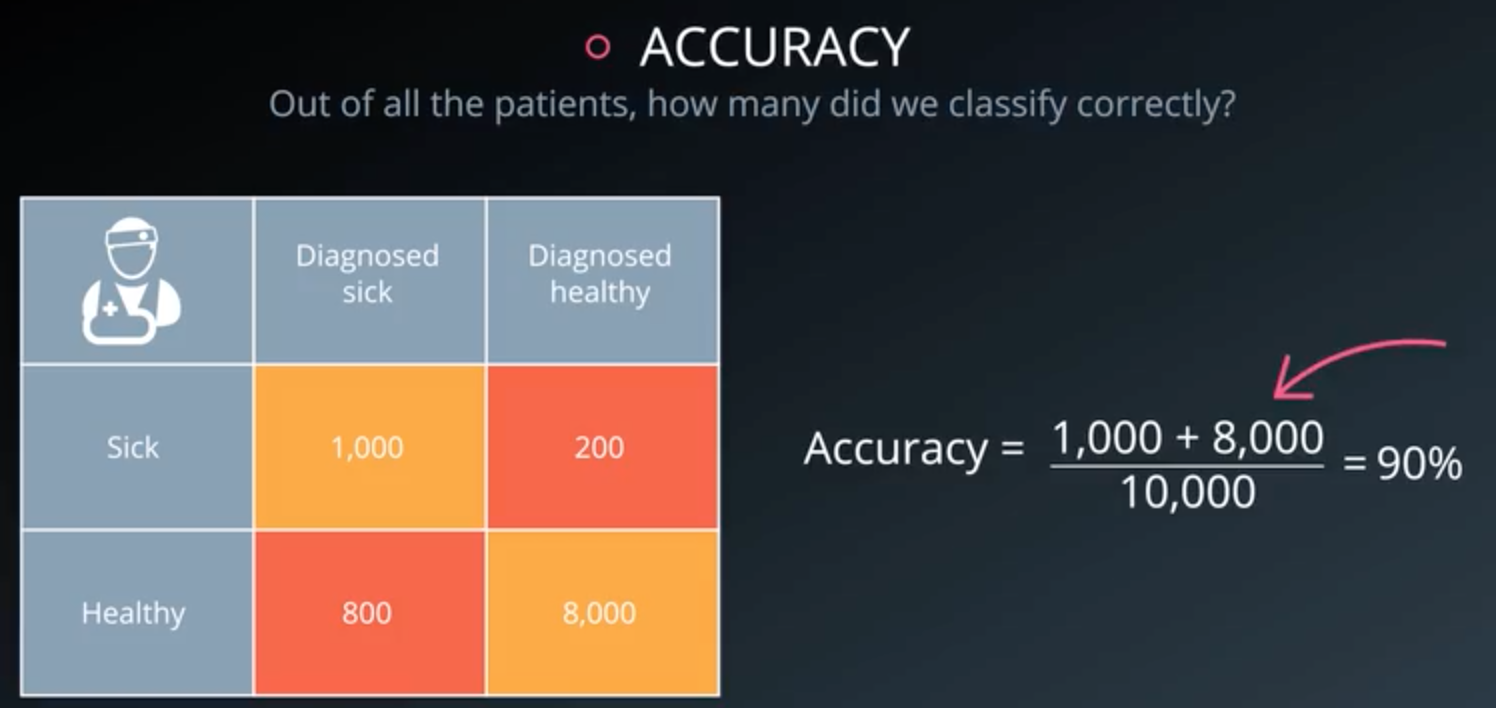
Accuracy
- One of the ways to measure how good model is
- accuracy = (True Positive + True Negative) / total
Example:
Code:
from sklearn.metrics import accuracy_score

accuracy_score(y_true, y_pred)
Regression Metrics
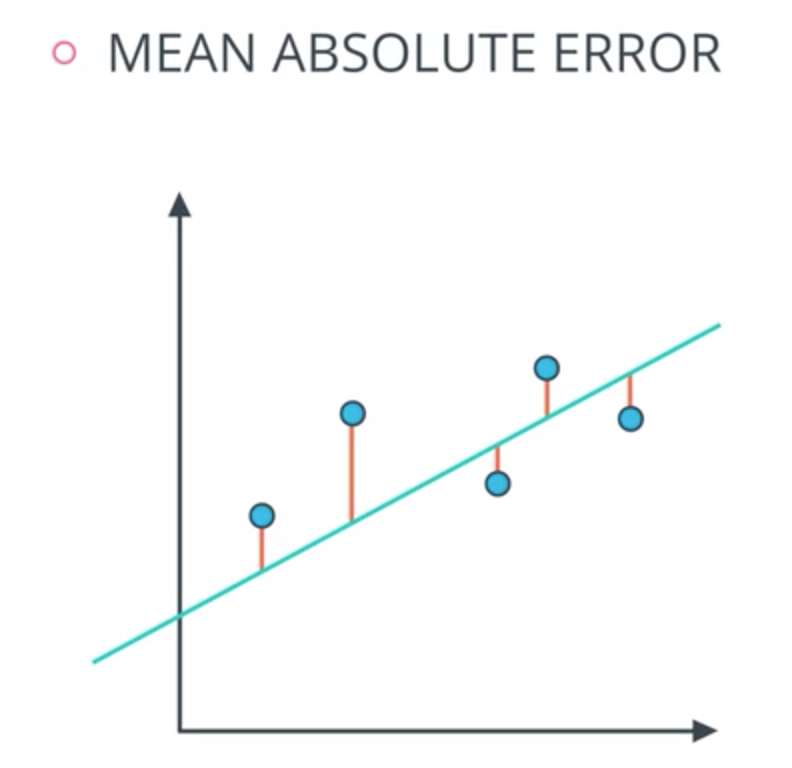
Mean Absolute Error
- Distances to the points to the line.
Code:
from sklearn.metrics import mean_abosolute_error
from sklearn.linear_mode import LinearRegression

classifier = LinearRegression()
classifier.fit(X, y)

guesses = classifier.predict(X)

error = mean_abosolute_error(y, guesses)
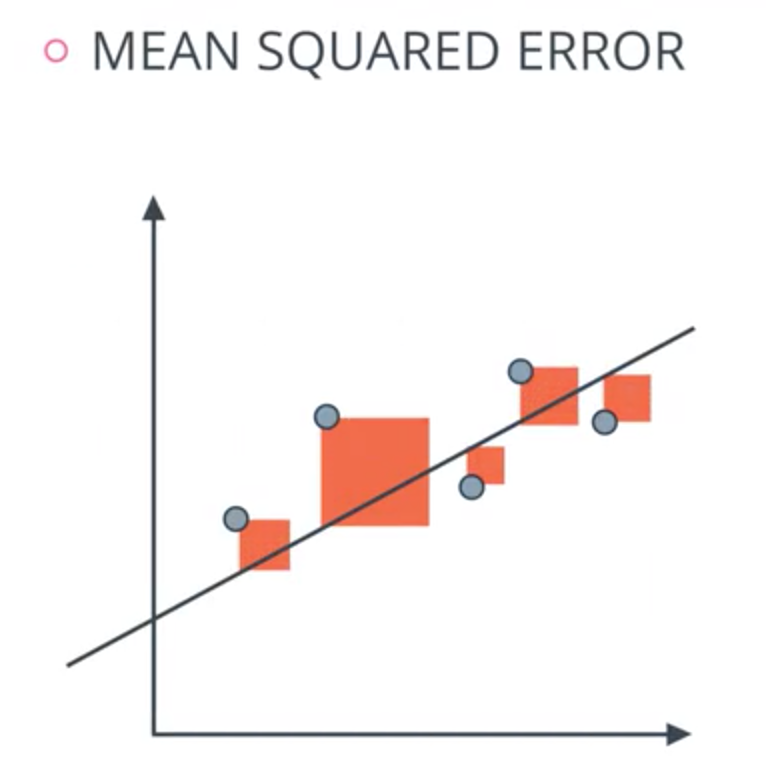
Mean Squared Error
- Squares of the distances to the points to the line.
Code:
from sklearn.metrics import mean_squared_error
from sklearn.linear_mode import LinearRegression

classifier = LinearRegression()
classifier.fit(X, y)

guesses = classifier.predict(X)

error = mean_squared_error(y, guesses)
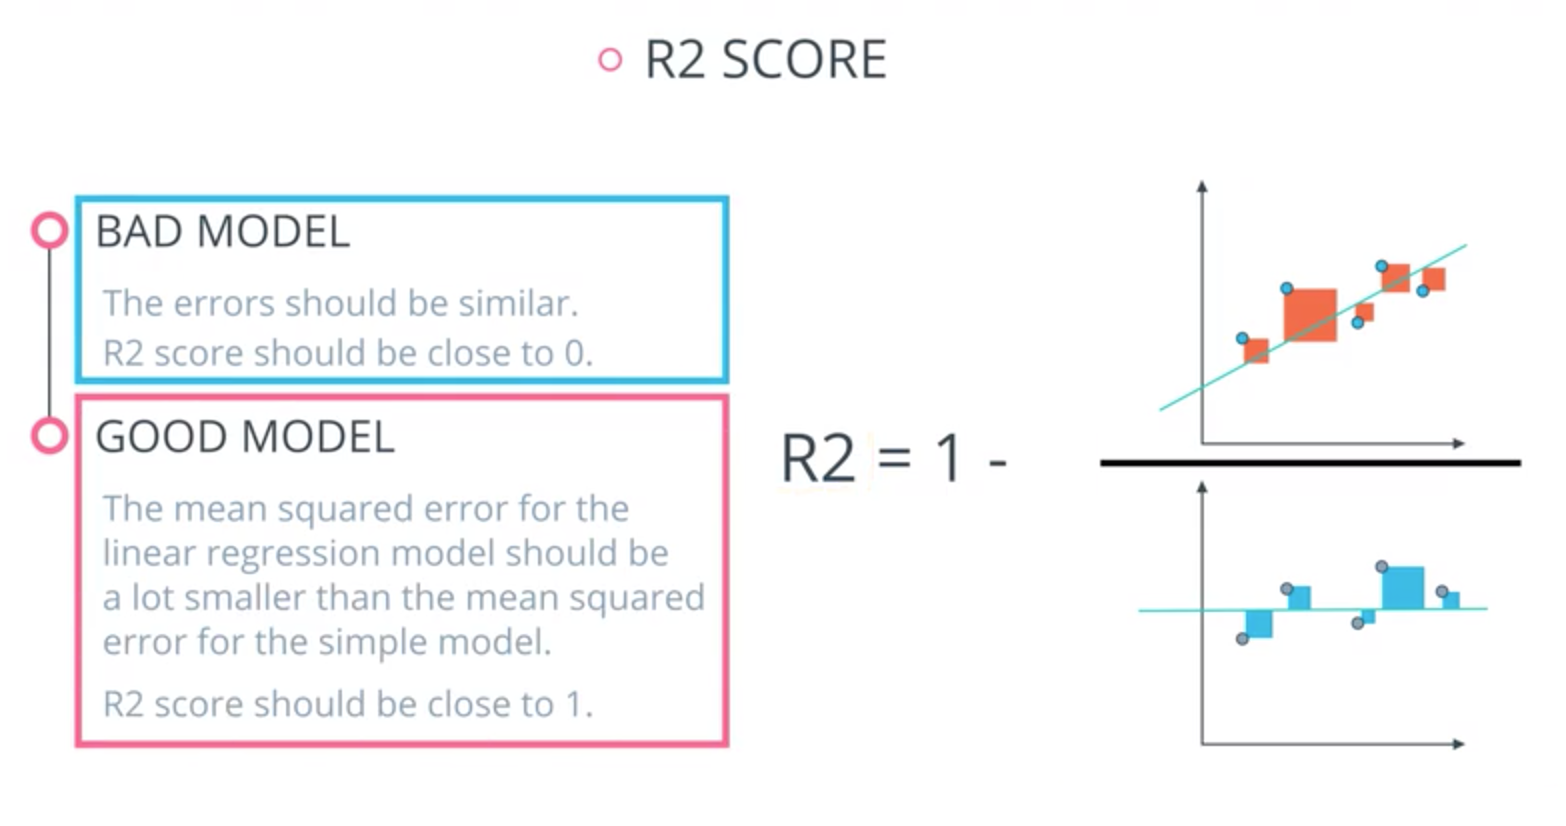
R2 score
- R2 Score is based on comparing our model to the simplest possible model.
- What is the simplest possible model that fits a bunch of points?
- the average of all the values and draw a horizontal line through them.
Code:
from sklearn.metrics import r2_score

y_true = [1, 2, 4]
y_pred = [1.3, 2.5, 3.7]

r2_score(y_true, y_pred)
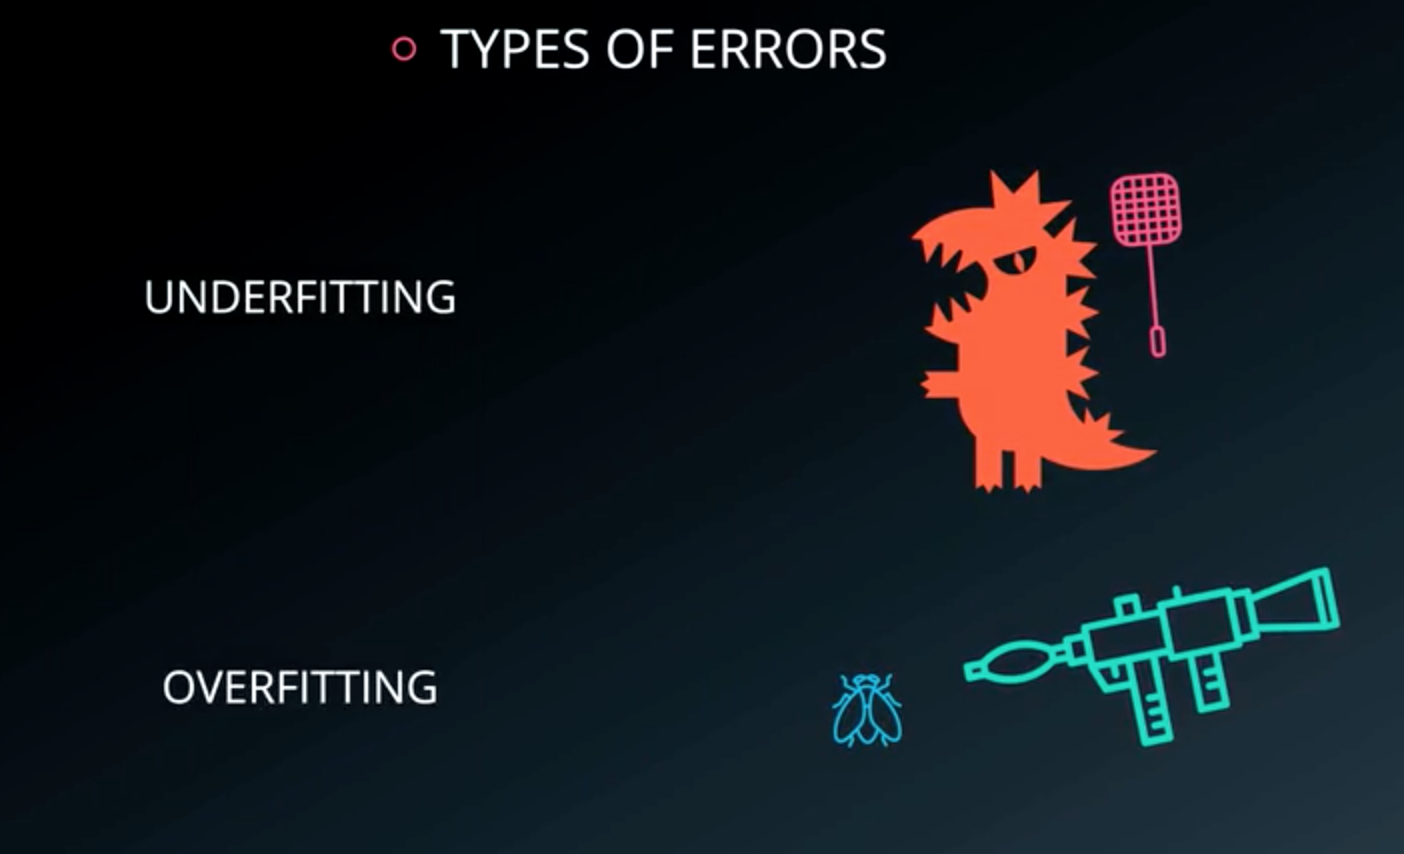
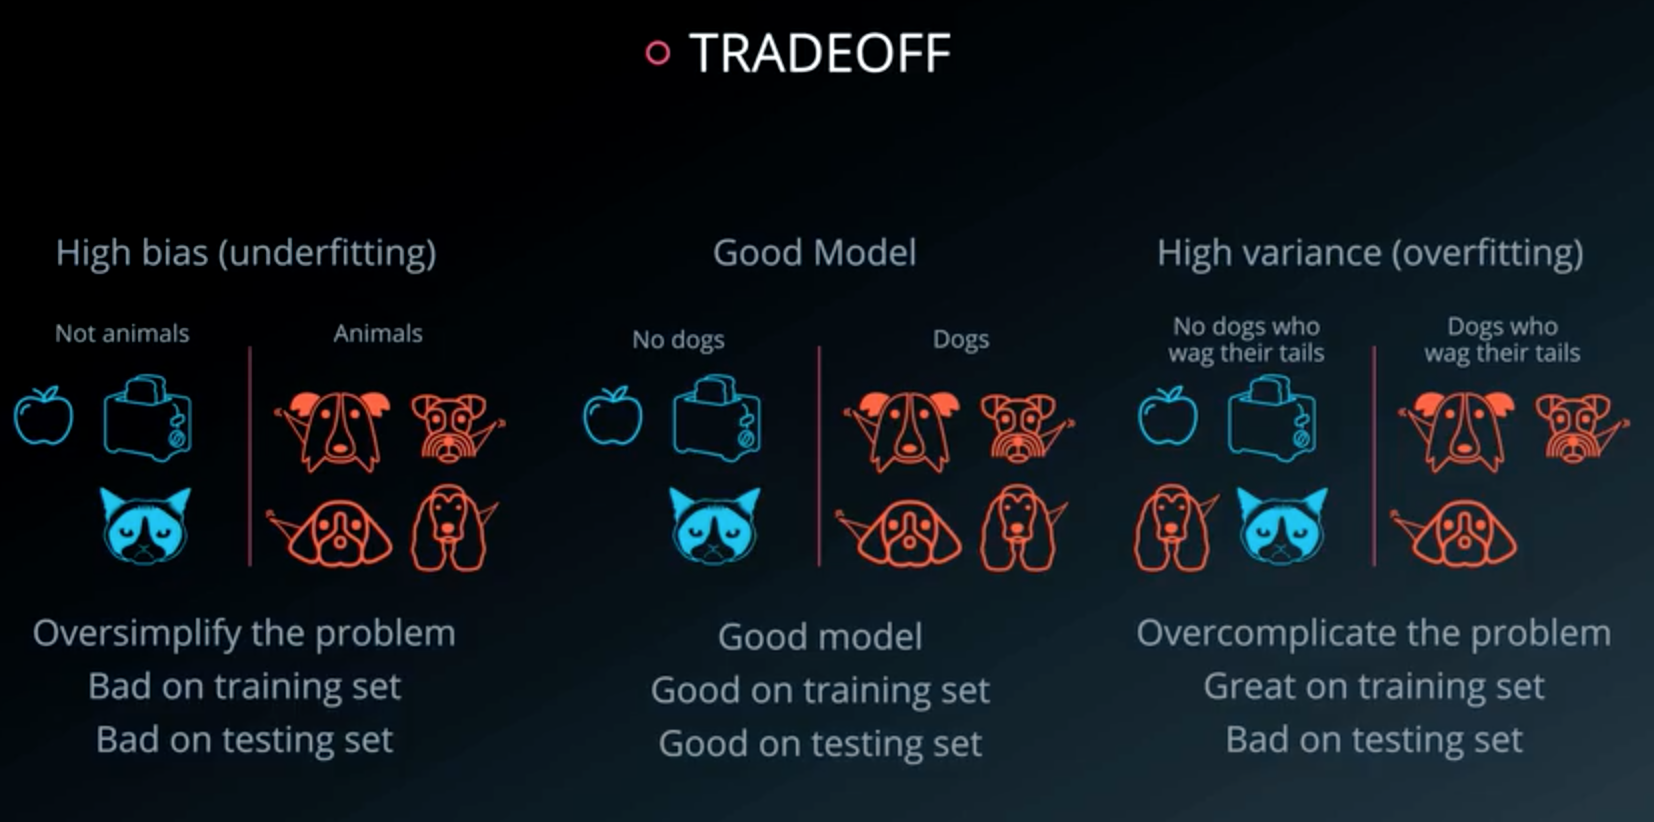
Types of Errors
- Oversimplify the problem: underfitting
- Error due to in bias
- Overcomplicate the problem: overfitting
- Error due to in variance
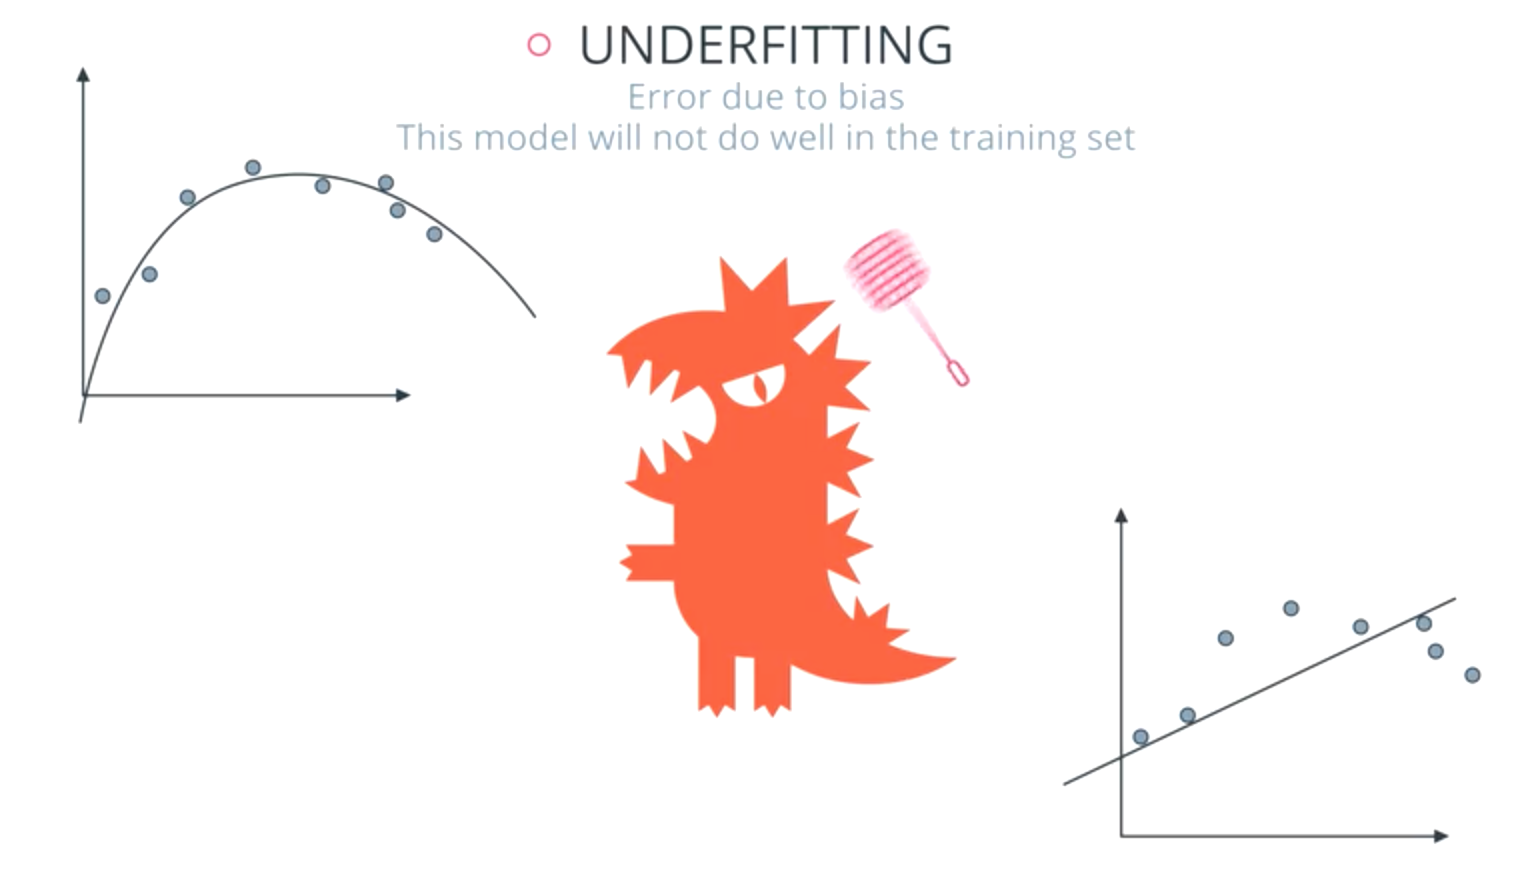
Underfitting:
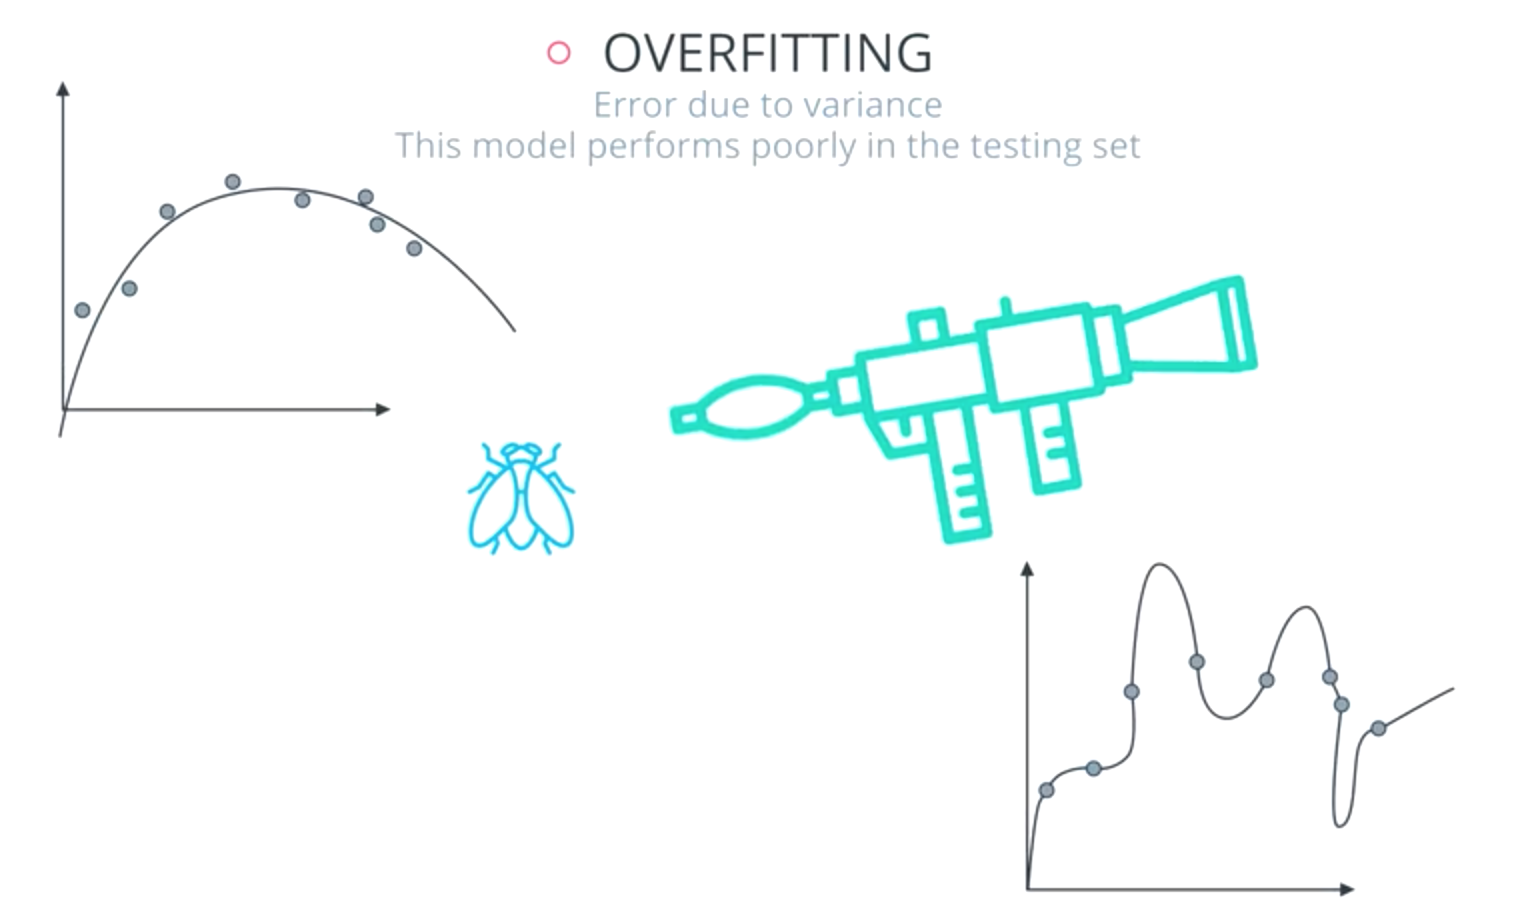
Overfitting:
Tradeoff:
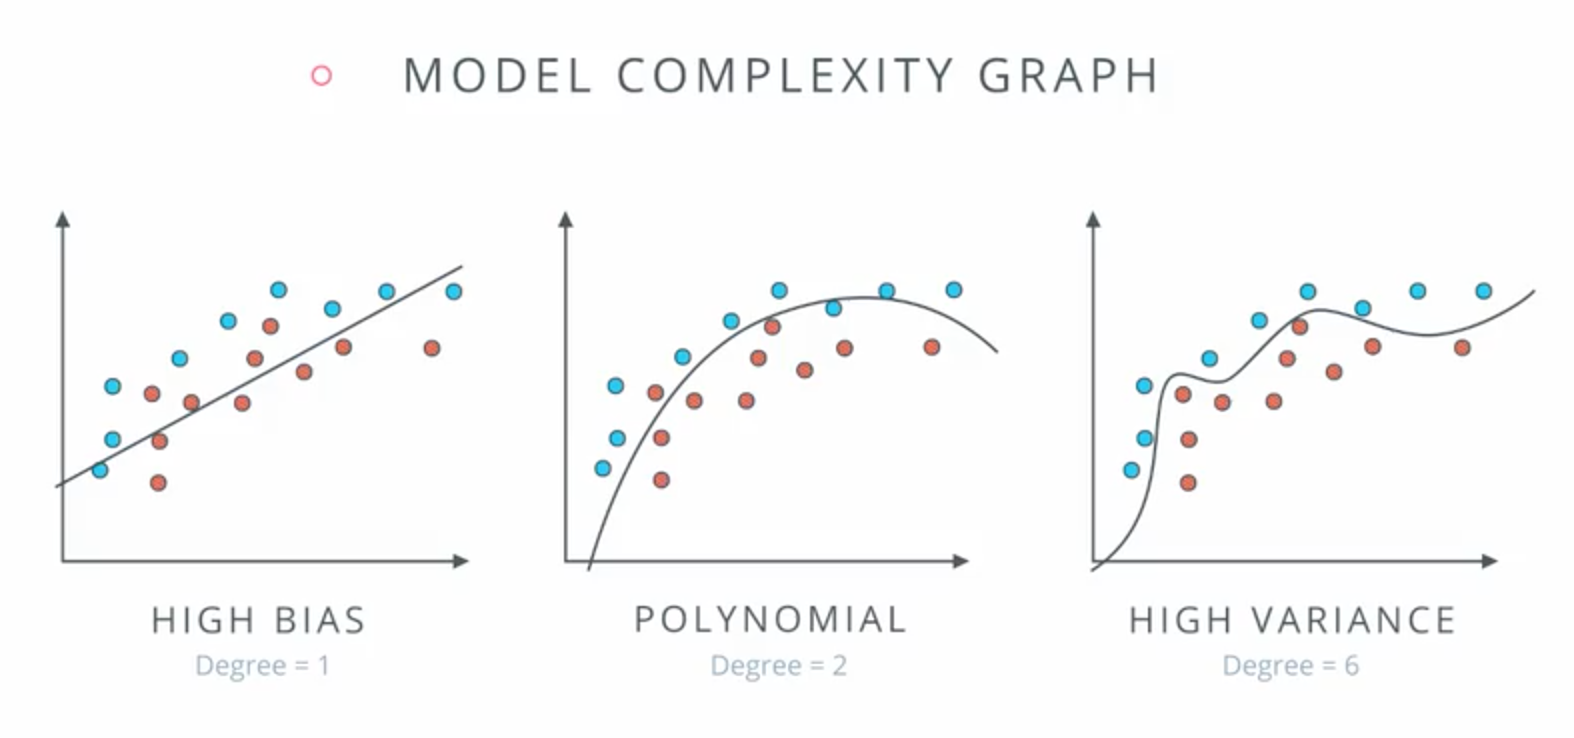
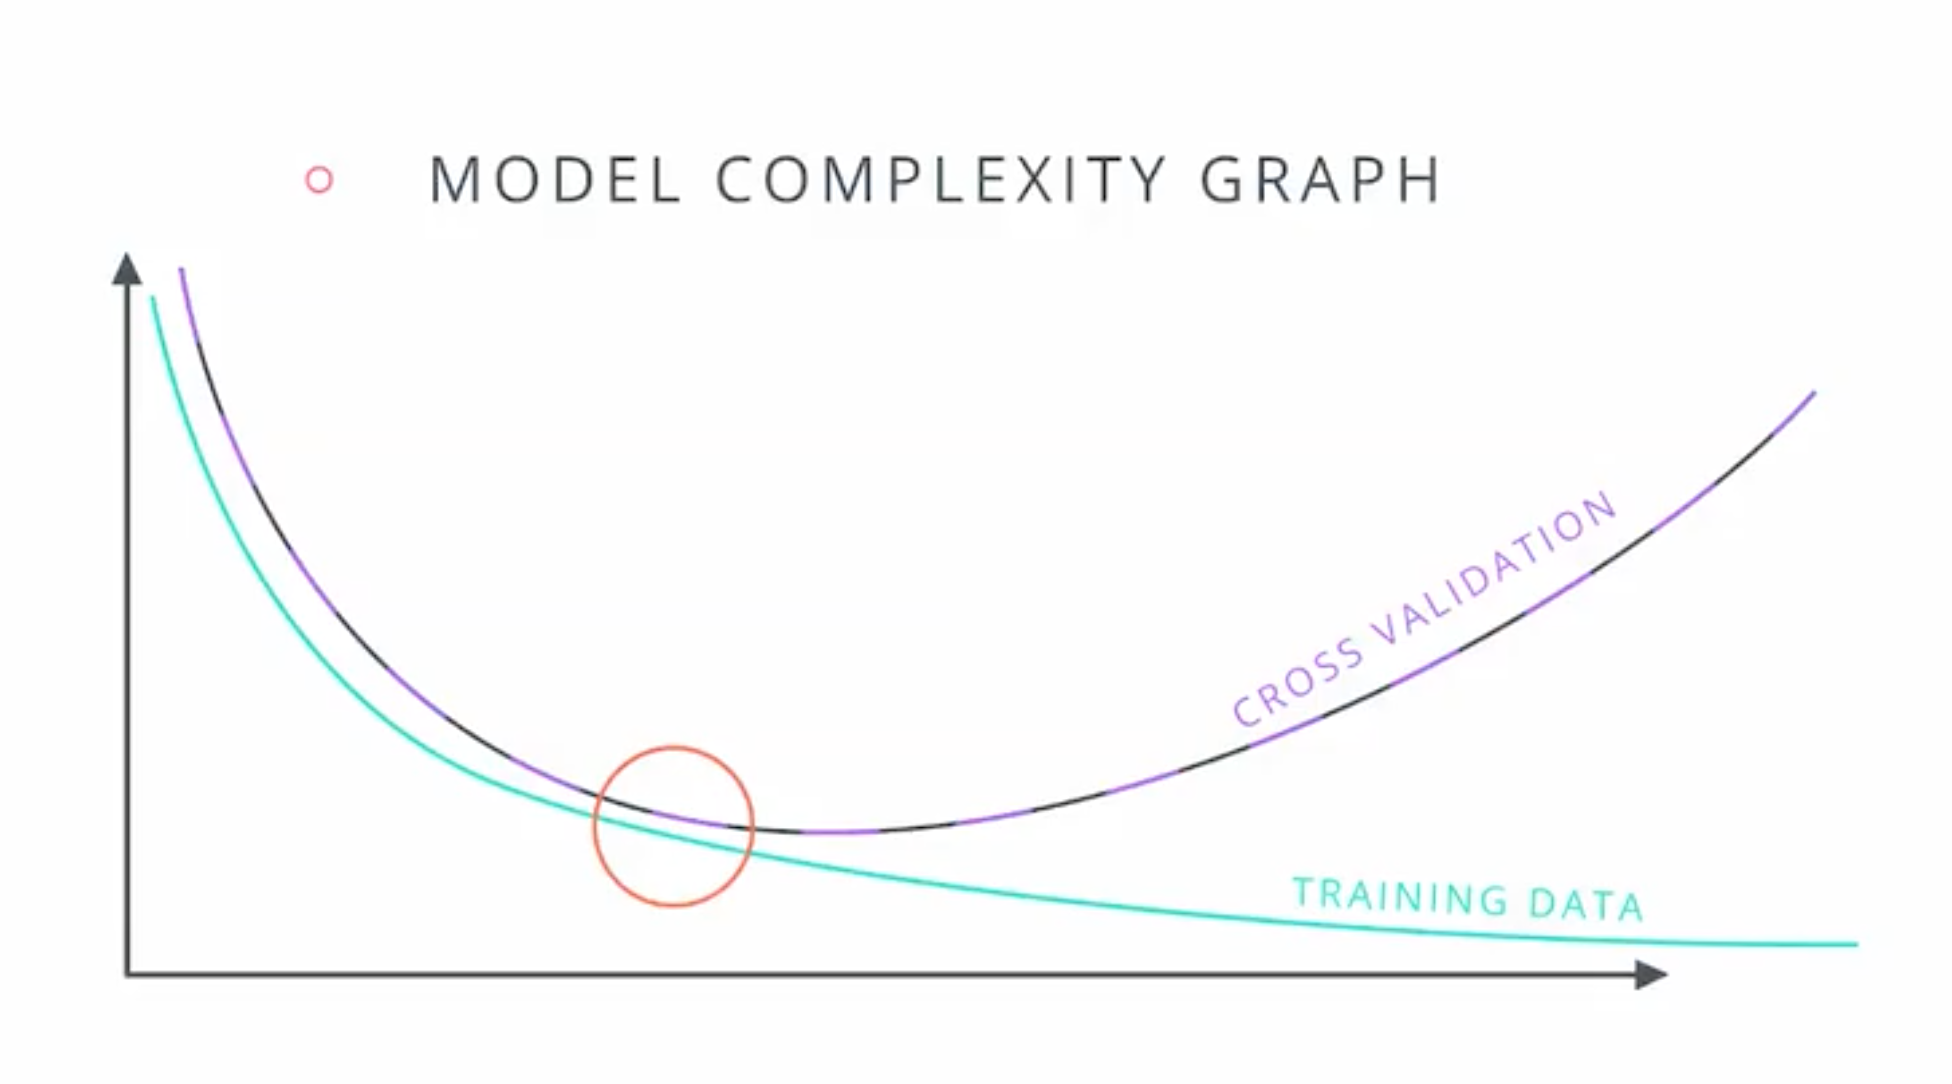
Model Complexity Graph
- Detect training model error.
Training models example:
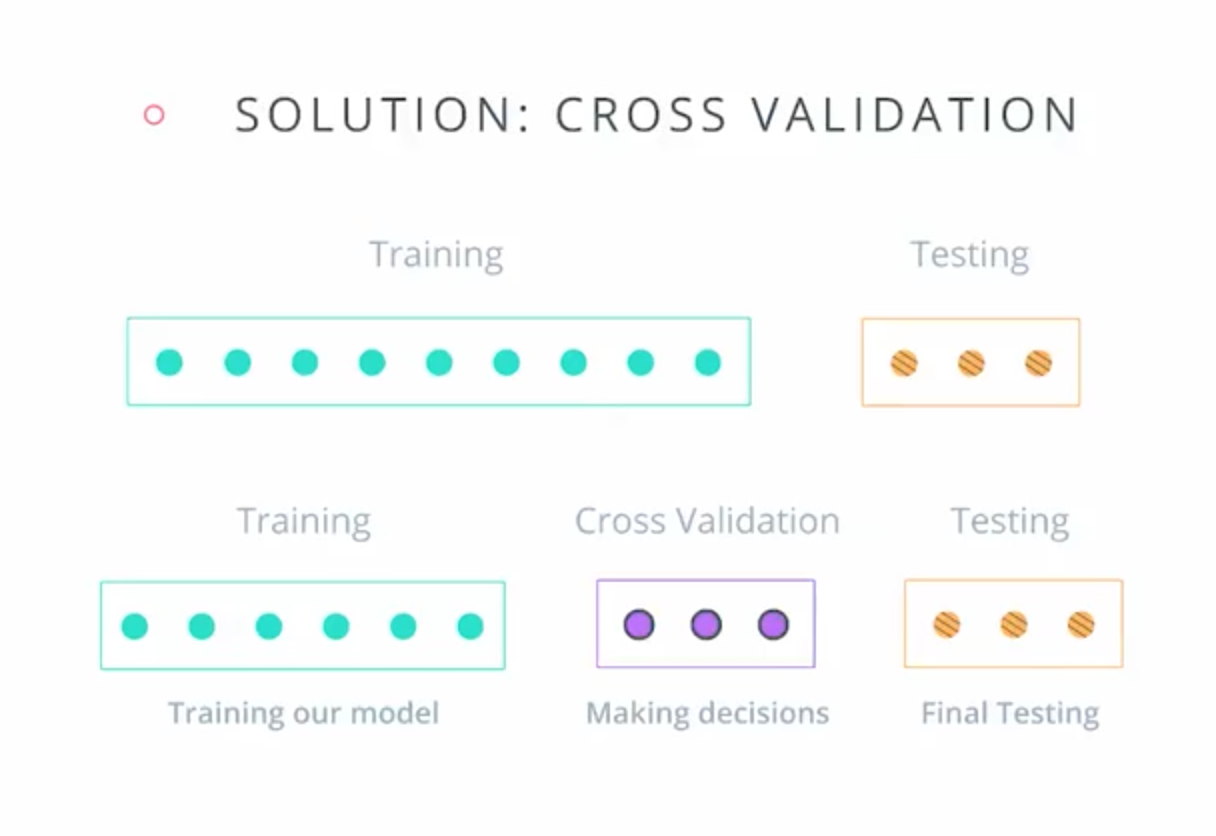
Cross-Validation data:
- Used for making decisions about the model.
Errors of each training model:
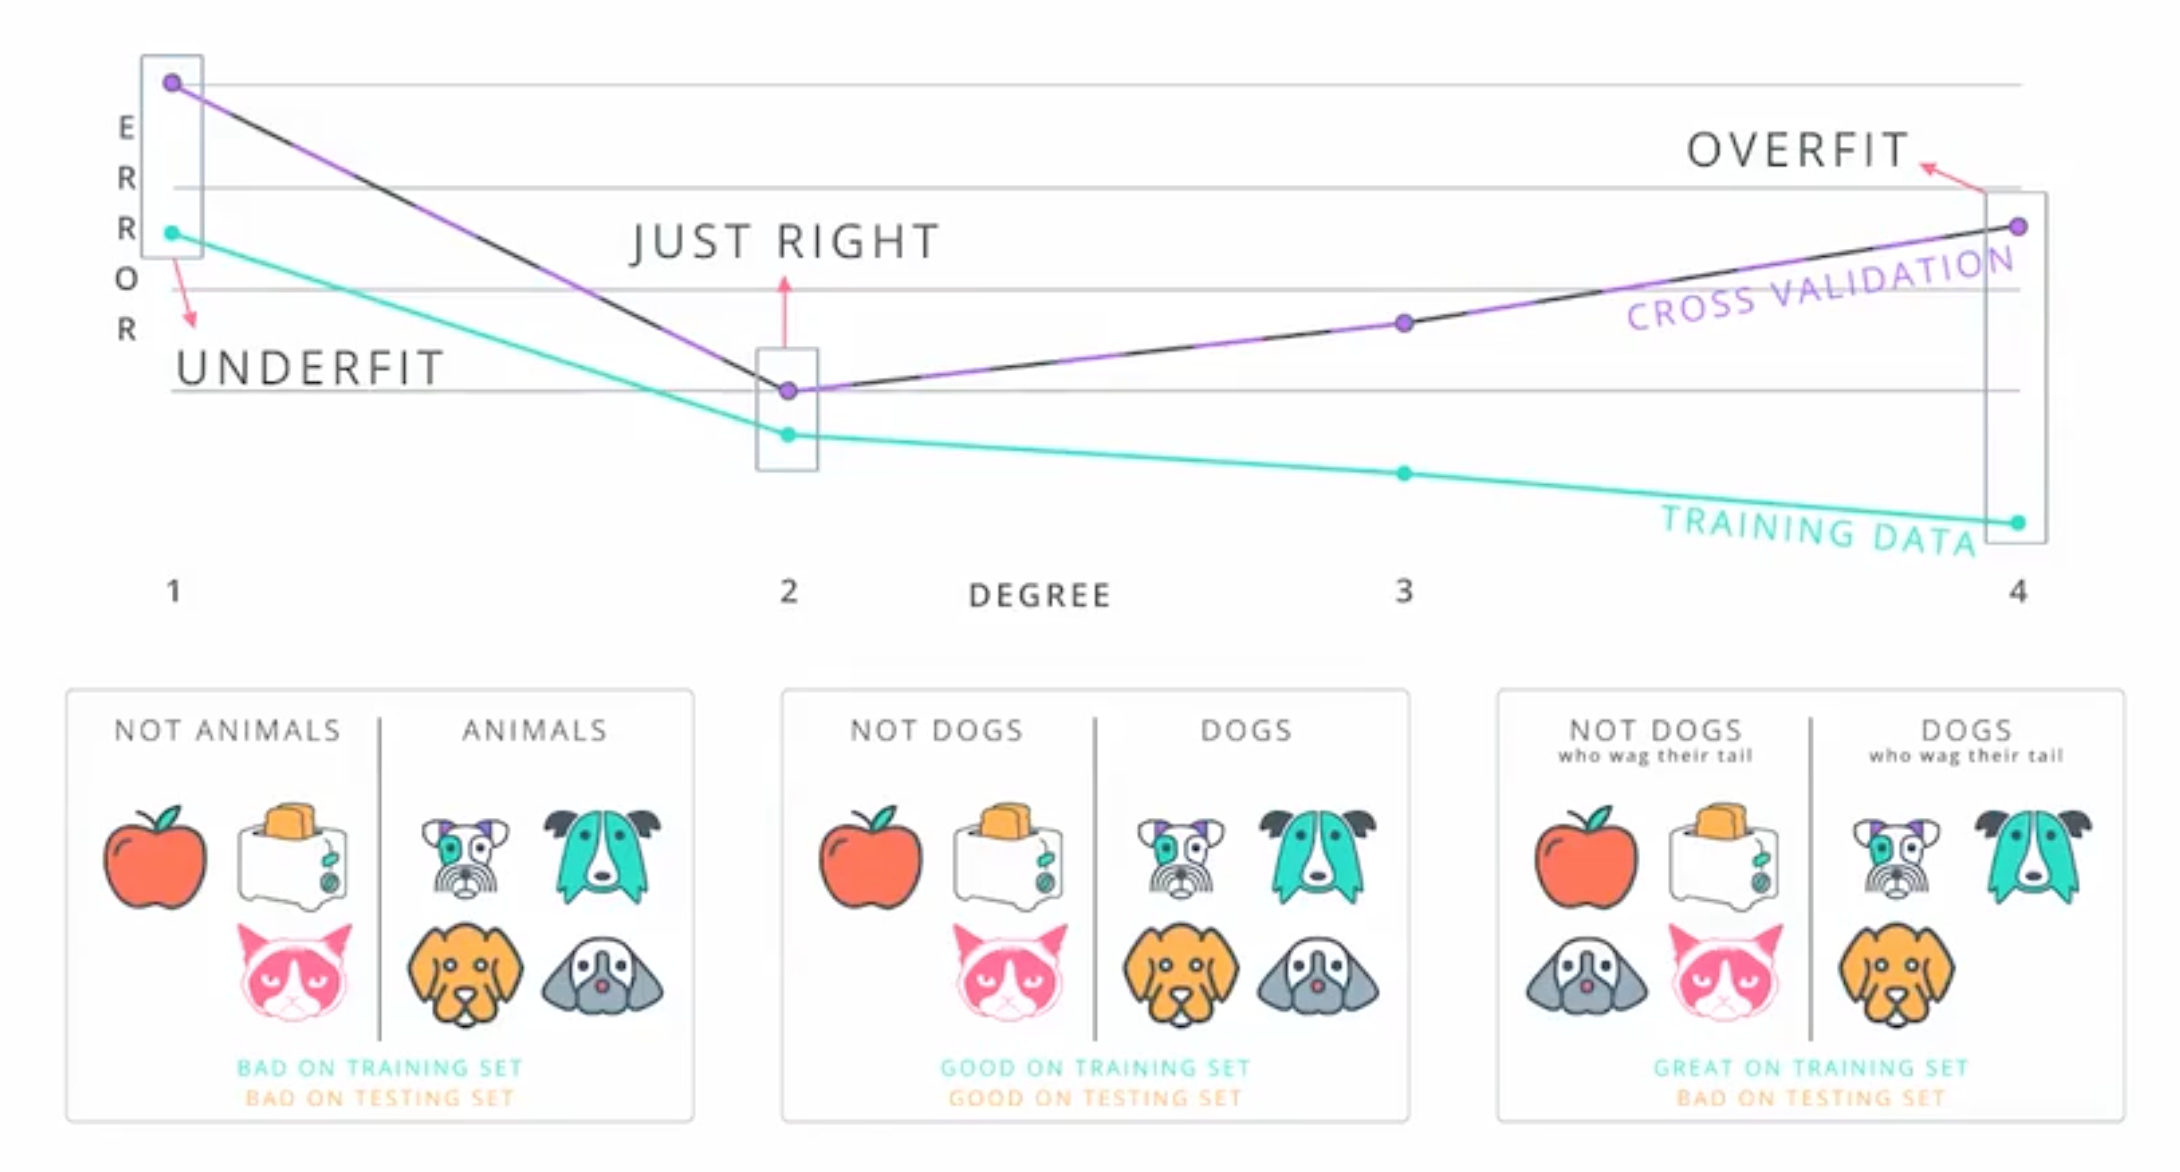
Real-life model complexity graph:
- on left side underfit
- on right side overfit
K-Fold Cross Validation
- Method to recycle our data
- Is there anything to not throw away useful data to test data?
- Break our data in to K buckets
- Then we just train our model K times.
- Each time using a different bucket as our testing set and the remaining points as our training set.
- Then we average the results to get a final model.
Code:
from sklearn.model_selection import KFold

kf = KFold(12, 3, shuffle=True)

for train_indices, test_indices in kf:
    print(train_indices, test_indices)